Many scientific disciplines deal with the temporal characteristics of nature. Detailed knowledge of the causes and consequences of the seasons is important in agriculture, weather and climate research, ecology, medicine and tourism. This web portal offers a lot of interesting information on this topic.more

Image: LaMantarraya, stock.adobe.commore

Long Series of Data

Cherry Tree
Image: Benjamin Gimmel

In Switzerland, several phenological events have been observed in a long tradition and recorded in long rows. Some of the more than one hundred year old series of data are presented here.


PhaenoNet

Gemeinsam die Jahreszeiten in der Natur erforschen PhaenoNet ermöglicht Beobachtungen zur jahreszeitlichen Veränderung von Pflanzen zu erfassen und mit anderen zu teilen. Dieses Netzwerk vereinigt Schüler*innen, Studierende, Lehrpersonen, Expert*innen, Wissenschaftler*innen und interessierte Lai*innen im Dienste der Phänologie.
Image: PhaenoNet, Eric Wiyss

PhaenoNet ist ein Netzwerk von Beobachter*innen der Natur und der Jahreszeiten, die ihre Beobachtungen auf einer gemeinsamen Plattform teilen

Ziele von PhaenoNet:

Möglichst viele Leute für die wissenschaftliche Beobachtung der jahreszeitlichen Phänomene zu begeistern.
Die Erforschung der Auswirkungen des Klimawandels auf die jahreszeitlichen Phänomene und die Verbesserung der Pollenprognosen.
Die Öffnung des Dialogs zwischen der Forschung, der Bildung und der Öffentlichkeit.

PhaenoNet WebApp: Hier kannst du deine Beobachtungen zur jahreszeitlichen Veränderung von Pflanzen erfassen und damit mithelfen den Klimawandel zu dokumentieren und besser zu verstehen.
Blooming of the cherry tree in Liestal

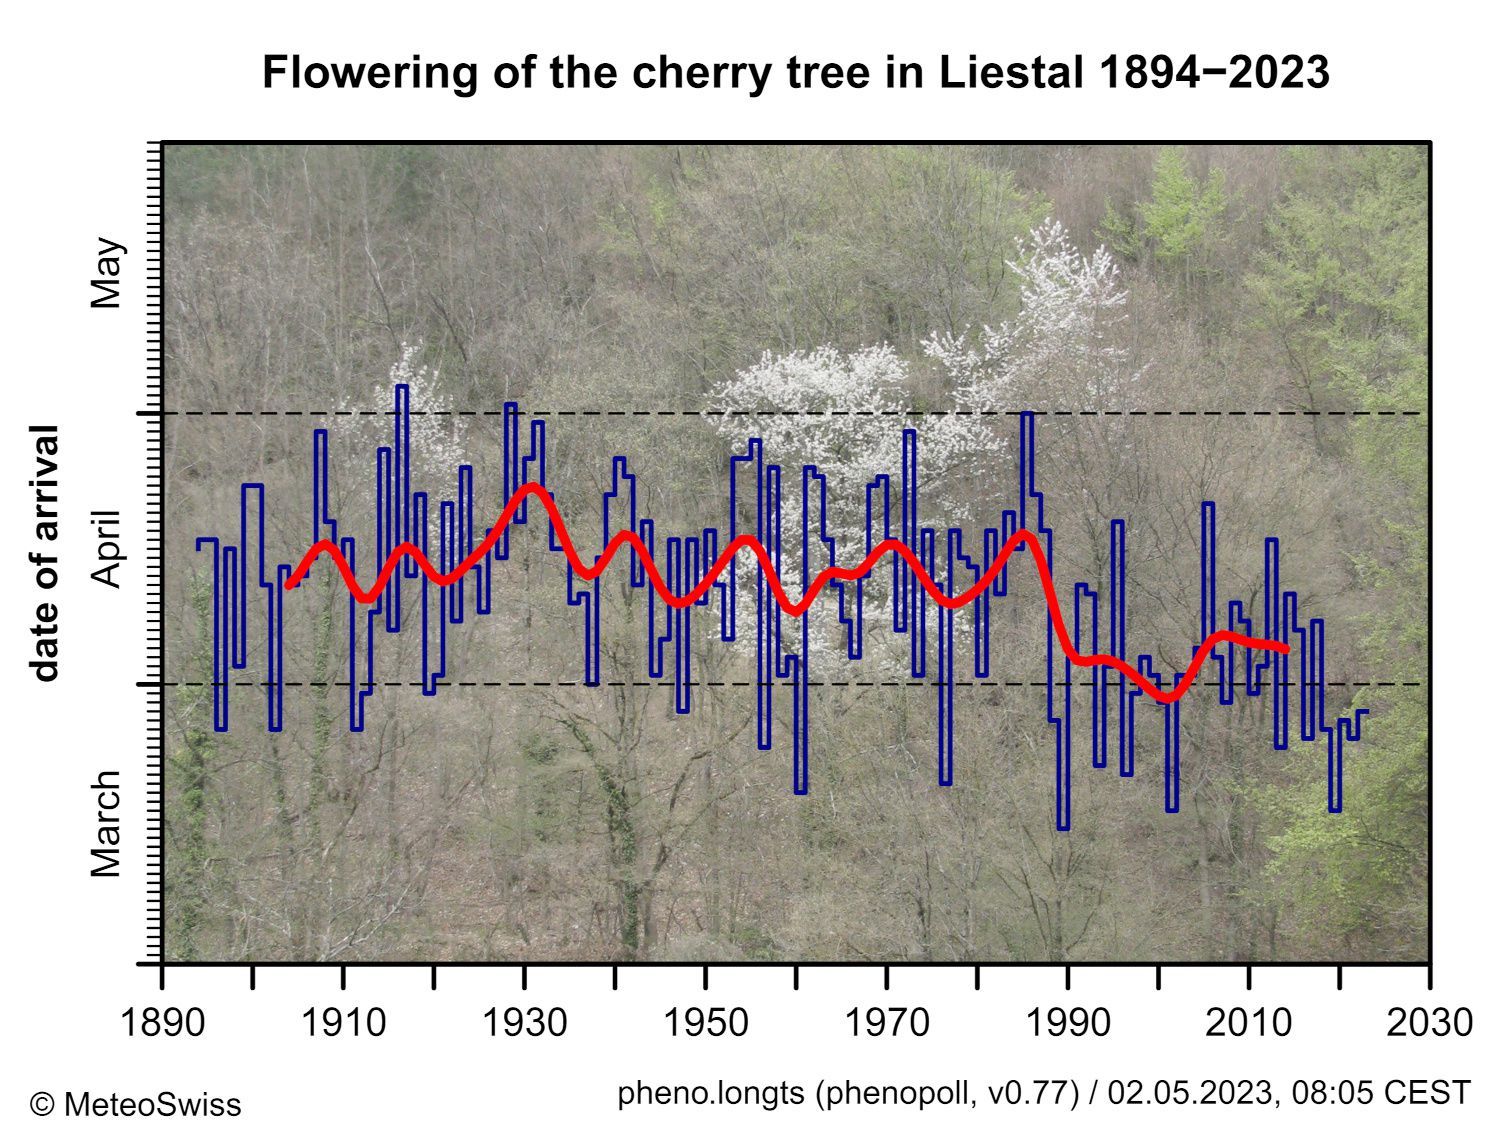
Blooming of the cherry tree in Liestal-Weideli since 1894. The red line shows the 20-year weighted average (Gaussian low-pass filter). Data source: Landw. Zentrum Ebenrain, Sissach and MeteoSwiss.
Blooming of the cherry tree in Liestal-Weideli since 1894. The red line shows the 20-year weighted average (Gaussian low-pass filter). Data source: Landw. Zentrum Ebenrain, Sissach and MeteoSwiss.Image: MeteoSchweiz

Budbreak of the horse chestnut tree in Geneva

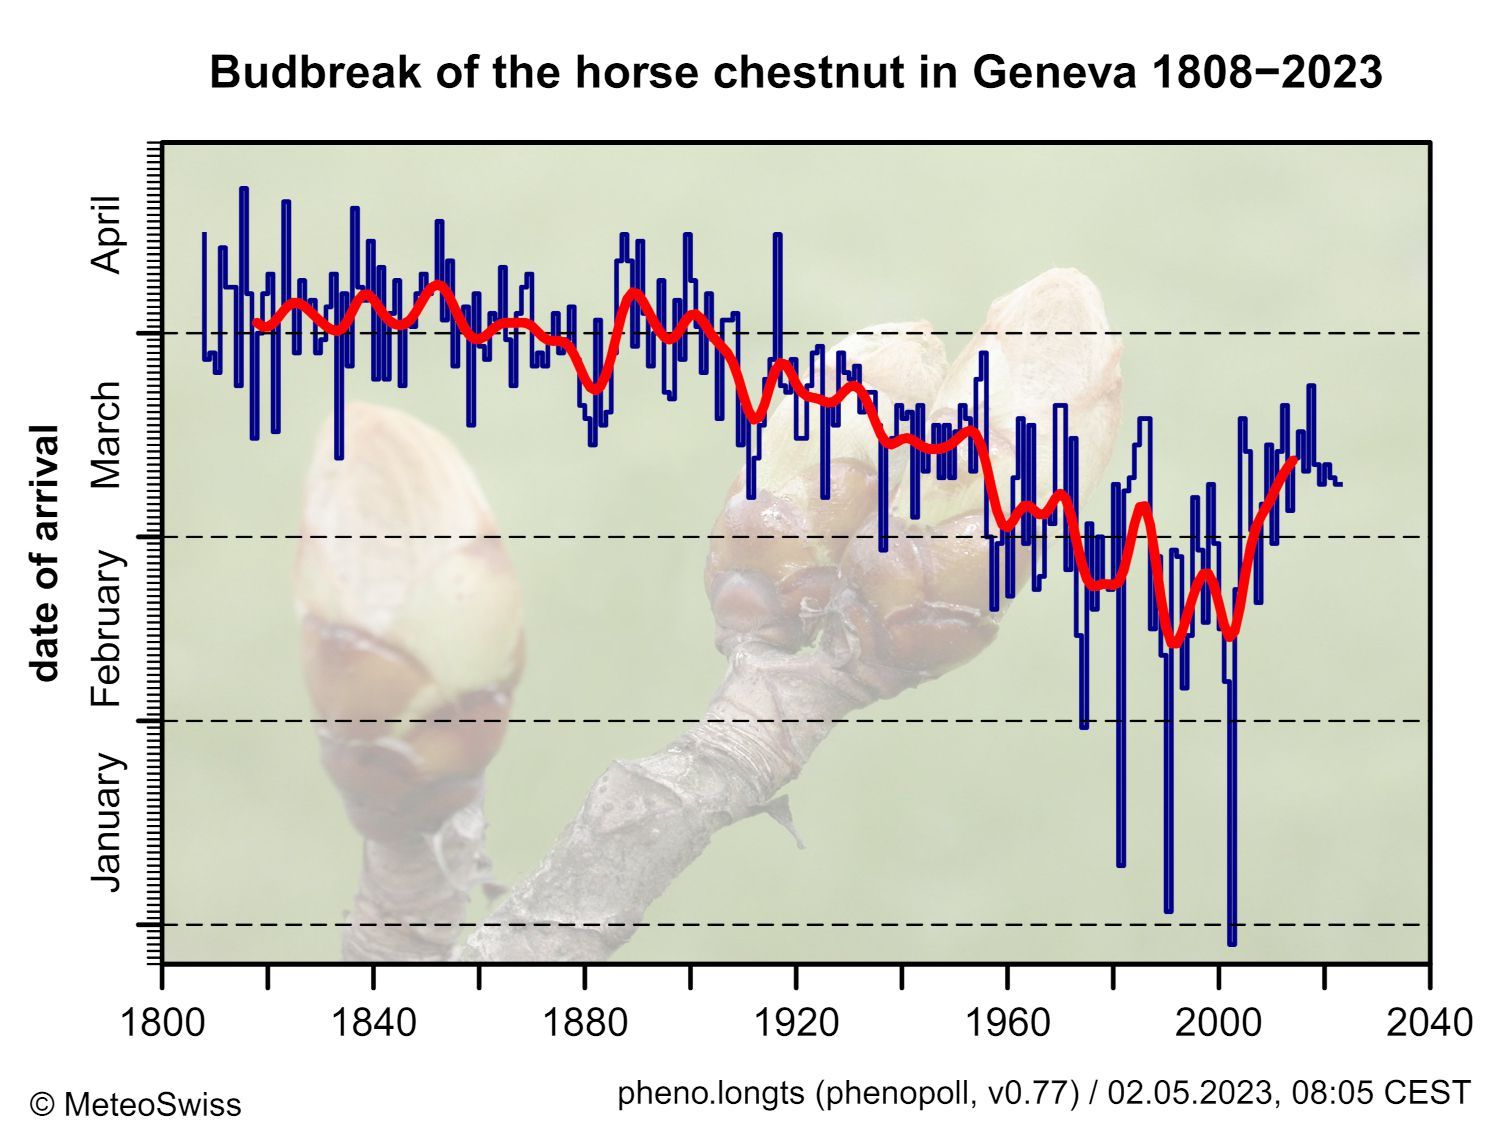
Budbreak of the horse chestnut tree in Geneva since 1808. The red line shows the 20-year weighted average (Gaussian low-pass filter). Data source: Grand Conseil de la République et canton de Genève.
Budbreak of the horse chestnut tree in Geneva since 1808. The red line shows the 20-year weighted average (Gaussian low-pass filter). Data source: Grand Conseil de la République et canton de Genève.Image: MeteoSwiss

Spring Index

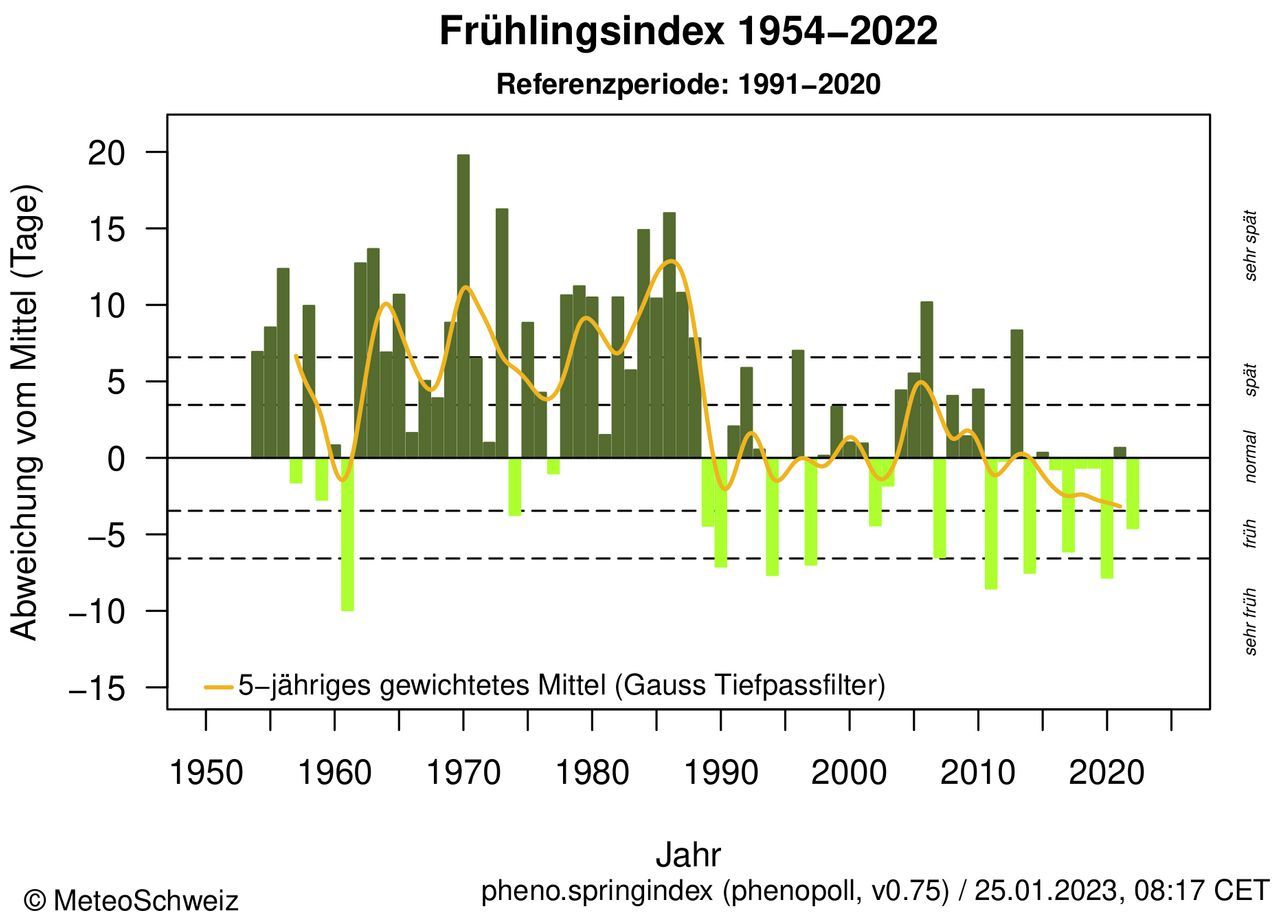
The spring index shows the difference (in days) in spring vegetation growth onset compared to the long-term average for the period 1991 to 2020. Dark green: years with later onset; light green: years with earlier onset; yellow: 5-year weighted average.
The spring index shows the difference (in days) in spring vegetation growth onset compared to the long-term average for the period 1991 to 2020. Dark green: years with later onset; light green: years with earlier onset; yellow: 5-year weighted average.Image: MeteoSchweiz

PhenObs: Ein globales Netzwerk Botanischer Gärten für phänologische Beobachtungen

PhenObs is a global network of botanical gardens bringing together researchers, students and citizen scientists to learn more about the impacts of climate change on the phenology of herbaceous plant species. https://www.idiv.de/en/phenobs.html
PhenObs is a global network of botanical gardens bringing together researchers, students and citizen scientists to learn more about the impacts of climate change on the phenology of herbaceous plant species. https://www.idiv.de/en/phenobs.htmlImage: iDIV, Halle-Jena-Leipzig
  • x-axis: year of observation
  • y-axis: day of the event
  • The solid line represents the smoothed data. The smoothing was done with a Bézier curve
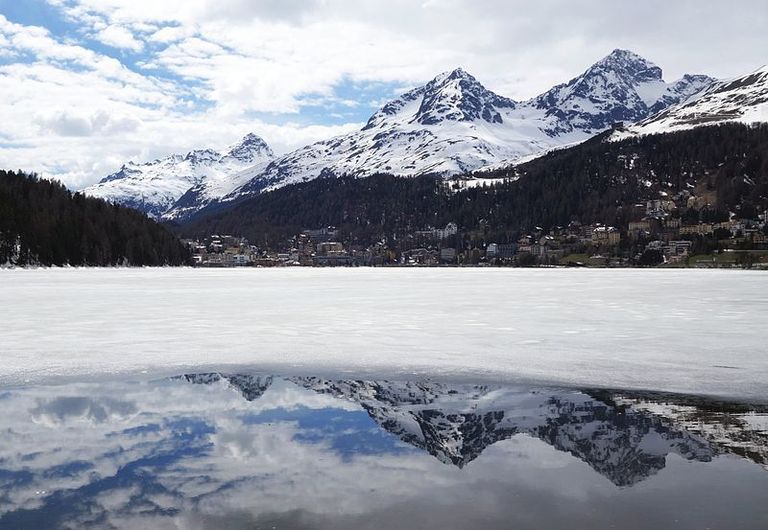
  • Since the beginning of the series of measurements, the ice on the lake usually disappeared in the second half of May (in 95 years in total).
  • From 1990 onwards, however, Lake St. Moritz presented itself ice-free as early as the end of April or in the first half of May at the latest.
  • The lake has only been free of the ice layer 28 times as early as April.
  • Thus, the lake thaws earlier and earlier over the years.

Eis auf dem St. Moritzersee
Image: Karl432, Wikimedia Commons

Lake St. Moritz during thaw weather

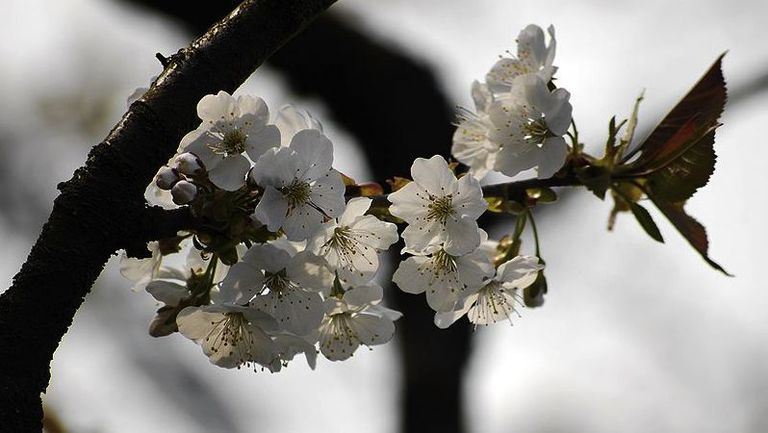
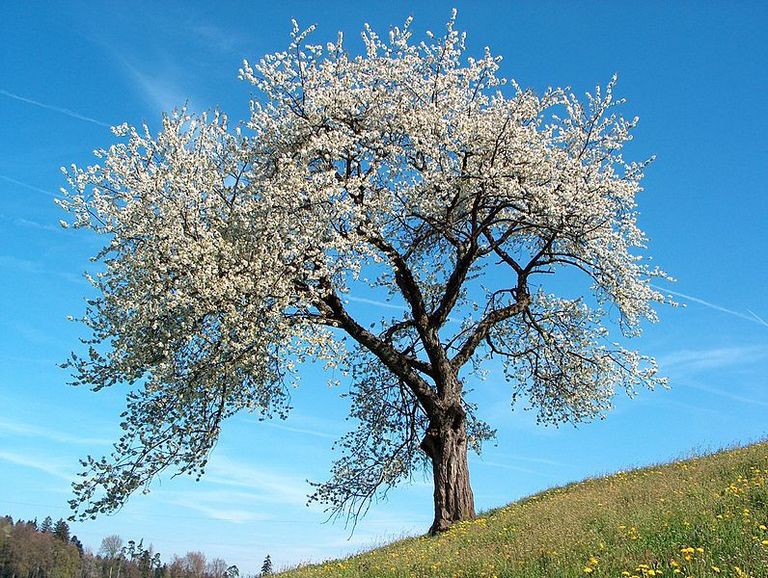
  • The observed tree in Liestal is a wild cherry tree on the edge of a forest.
  • Its flowering has been repeating quite stably in April since the beginning of the measurement.
  • Since the 1990s, a trend towards earlier flowering dates has been observed.


Kirschblüten
Image: Pro2, Wikimedia Commons

Cherry Blossoms

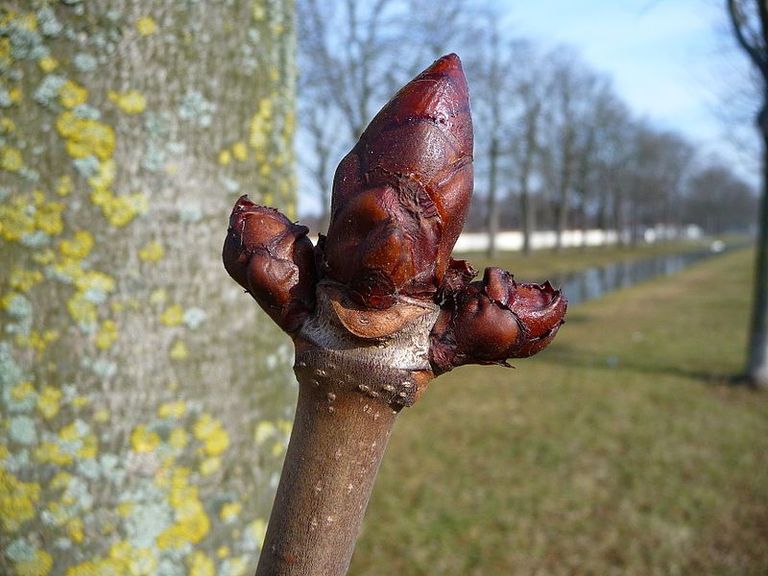
  • The horse chestnut in Geneva develops its leaves much earlier today than was the case 200 years ago. When measurement began the first buds usually burst in April, today the first burst more recently in February or March.
  • This trend is likely to be influenced by global warming, as well as by structural changes and stronger warming in the city of Geneva.


Rosskastanie Knospe

Bud of a Horse Chestnut in February